선형적으로 구분되지 않는 분류 문제를 해결하기 위해 커널 방법을 사용할 수 있다.
선형적으로 구분되지 않는 데이터
import matplotlib.pyplot as plt
import numpy as np
np.random.seed(1)
X_xor=np.random.randn(200,2)
y_xor=np.logical_xor(X_xor[:,0]>0, X_xor[:,1]>0)
y_xor=np.where(y_xor, 1, -1)
plt.scatter(X_xor[y_xor==1, 0], X_xor[y_xor==1, 1], c='b', marker='x', label='1')
plt.scatter(X_xor[y_xor==-1, 0], X_xor[y_xor==-1, 1],c='r', marker='s', label='-1')
plt.xlim([-3, 3])
plt.ylim([-3, 3])
plt.legend(loc='best')
plt.tight_layout()
plt.show()

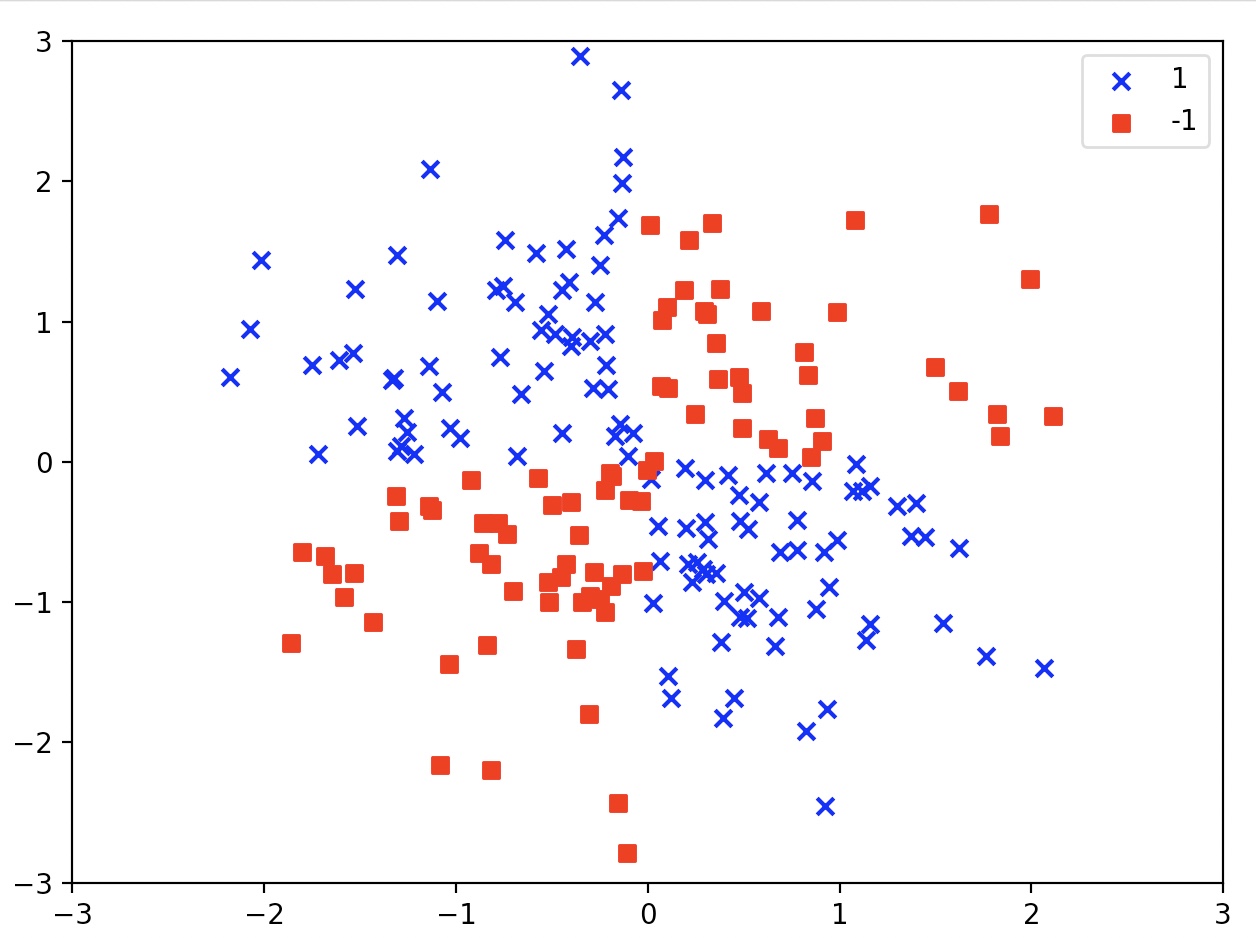
numpy의 logicl_xor 함수를 이용해서 만든 XOR 형태의 비선형 데이터 셋
이와 같이 선형적으로 구분되지 않는 데이터를 다루는 커널 방법(kernel method)의 기본 아이디어는
매핑 함수를 이용하여 원본 특성의 비선형 조합을 선형적으로 구분되는 고차원 공간에 투영하는 것이다.
하지만 매핑 방식은 새로운 특성을 만드는 계산 비용이 매우 비싸다. (고차원일 수록 비쌈)
이를 위해 커널 기법(kernel trick)이 등장하게 된다.

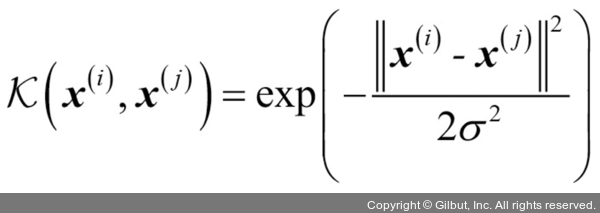
커널 함수(kernel function)은 위와 같이 정의된다. (pi는 매핑 함수임)
가장 널리 사용되는 커널 함수는 방사 기저 함수(Radial Basis function, RBF)이다.
( 가우시안 커널 Gaussian kernel 이라고도 불림 )

즉, 커널함수는 유사도를 점수로 바꾸어 주는 역할을 한다.
( 커널 함수가 1일 때 매우 유사한 샘플이고, 커널 함수가 0일 때 매우 다른 샘플이다. )
커널 방법은 고차원 표현을 실제로 만들지 않고 커널 함수의 계산 결과만 사용한다.
따라서 고차원에서의 결정 경계도 찾을 수 없다.
커널 방법을 사용할 때, SVM의 목적 함수와 커널 함수를 적용하여, w와 b를 소거한다.
이렇게 바뀐 목적함수를 쌍대함수(dual form)이라고 한다.
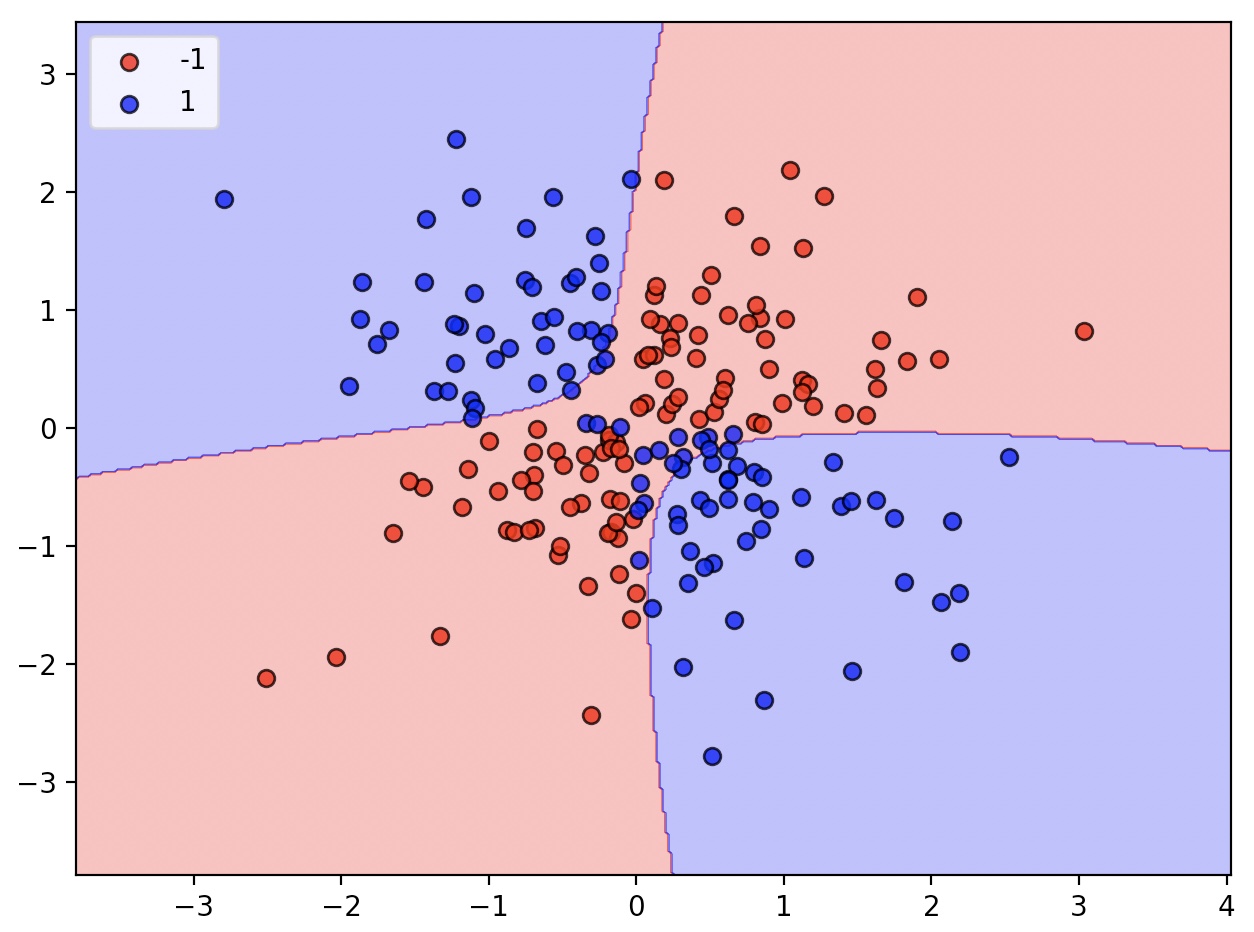
비선형 결정 구조를 위한 SVM은 앞서 사용한 SVC클래스를 사용하고
매개변수를 kernel=‘linear’에서 kernel=‘rbf’로 바꾸어 주면 된다.
svm=SVC(kernel='rbf', random_state=1, gamma=0.10, C=10.0)
svm.fit(X_xor, y_xor)
plot_decision_regions(X_xor, y_xor, classifier=svm)
plt.legend(loc='upper left')
plt.tight_layout()
plt.show()

gamma=0.1로 지정한 매개변수 감마는 가우시안 구(gaussian sphere)의 크기를 제한하는 매개변수이다.
감마 값이 커지면, 서포트 벡터의 영향이나 범위가 줄어든다.
결정 경계는 더욱 샘플에 가까워지고 구불구불해진다.
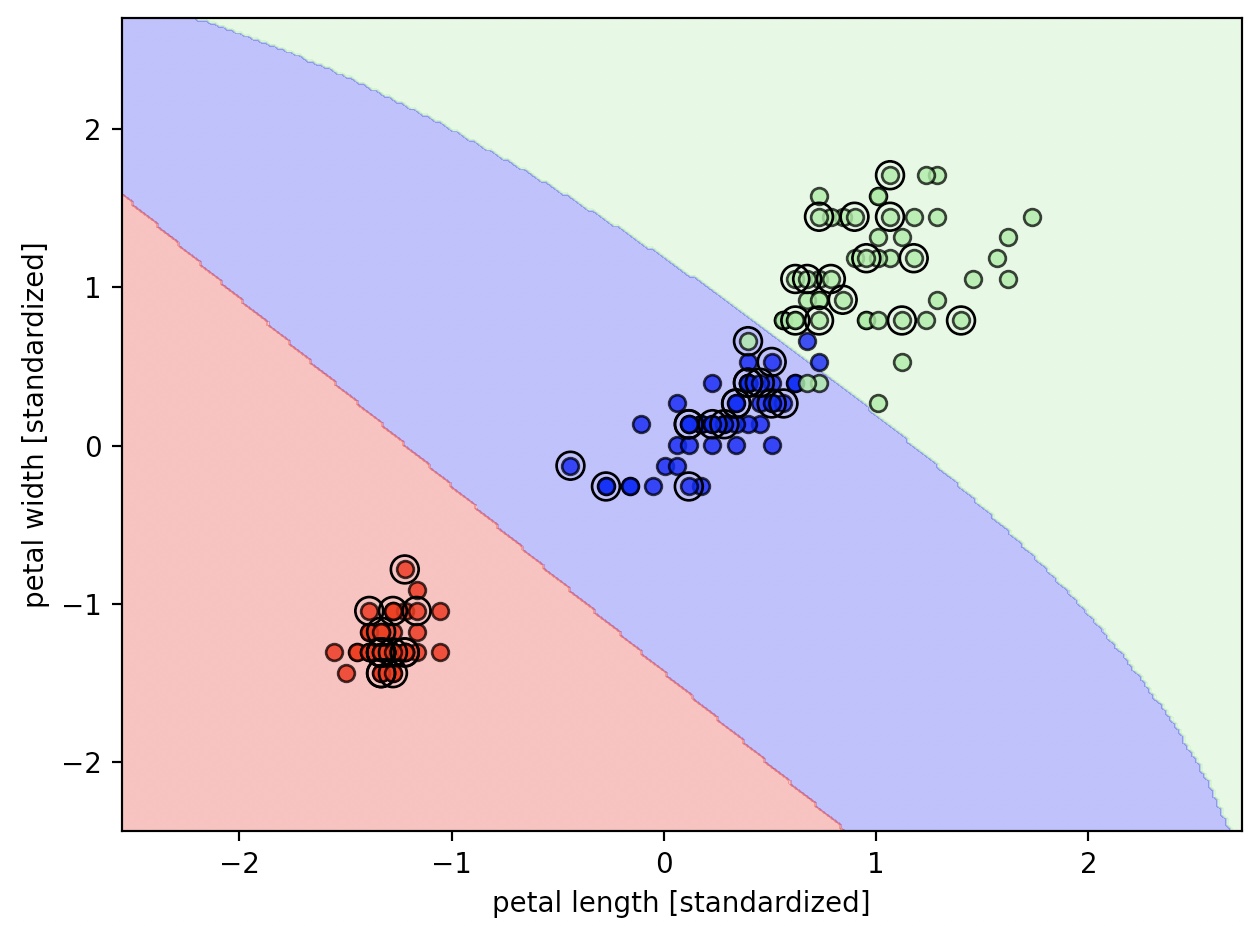
매개변수 감마값에 따른 분꽃 샘플 분류
svm=SVC(kernel='rbf'm random_state=1, gamma=0.2, C=1.0)
svm.fit(X_train_std, y_train)
plot_decision_regions(X_combined_std, y_combined, classifier=svm, test_idx=range(105,150))
plt.xlabel('petal length [standardized]')
plt.ylabel('petal width [standardized]')
plt.tight_layout()
plt.show()

svm=SVC(kernel='rbf', random_state=1, gamma=100.0, C=1.0)
svm.fit(X_train_std, y_train)
plot_decision_regions(X_combined_std, y_combined, classifier=svm, test_idx=range(105,150))
plt.xlabel('petal length [standardized]')
plt.ylabel('petal width [standardized]')
plt.tight_layout()
plt.show()

큰 감마값을 이용하면 클래스 0과 클래스 1 주위로 결정 경계가 매우 가깝게 나타난다.
이와 같은 분류기는 훈련 데이터 셋에는 잘 맞지만, 본적 없는 데이터에서는 일반화 오차가 높다.
감마변수 또한 과대적합 또는 분산을 조절하는 중요한 역할을 한다.
C값을 줄이면 편향이 늘고 모델 분산이 줄어든다
감마변수가 줄어들면 편향이 늘고 모델 분산이 커진다.